Time Series Graphics
Based on Ch2
Alison Hill
July 2, 2018
install.packages('fpp2', dependencies = TRUE)
# install.packages("devtools")
devtools::install_github("robjhyndman/fpp2-package")
Packages that may be useful:
tibbletimemight also be a useful package for us (check out vignettes!)
And this post: https://community.rstudio.com/t/how-do-you-do-time-series-forecasting-best-practices-tidy-ways-etc/4315/3
Blog post from Ogi using pandas: https://tomaugspurger.github.io/modern-7-timeseries
Possible time series data to work with?
- https://github.com/awesomedata/awesome-public-datasets#timeseries
- https://cascadiarconf.com/agenda/#craggy
library(fpp2)This loads ggplot2 and forecast.
autoplot(melsyd[,"Economy.Class"]) +
  ggtitle("Economy class passengers: Melbourne-Sydney") +
  xlab("Year") +
  ylab("Thousands")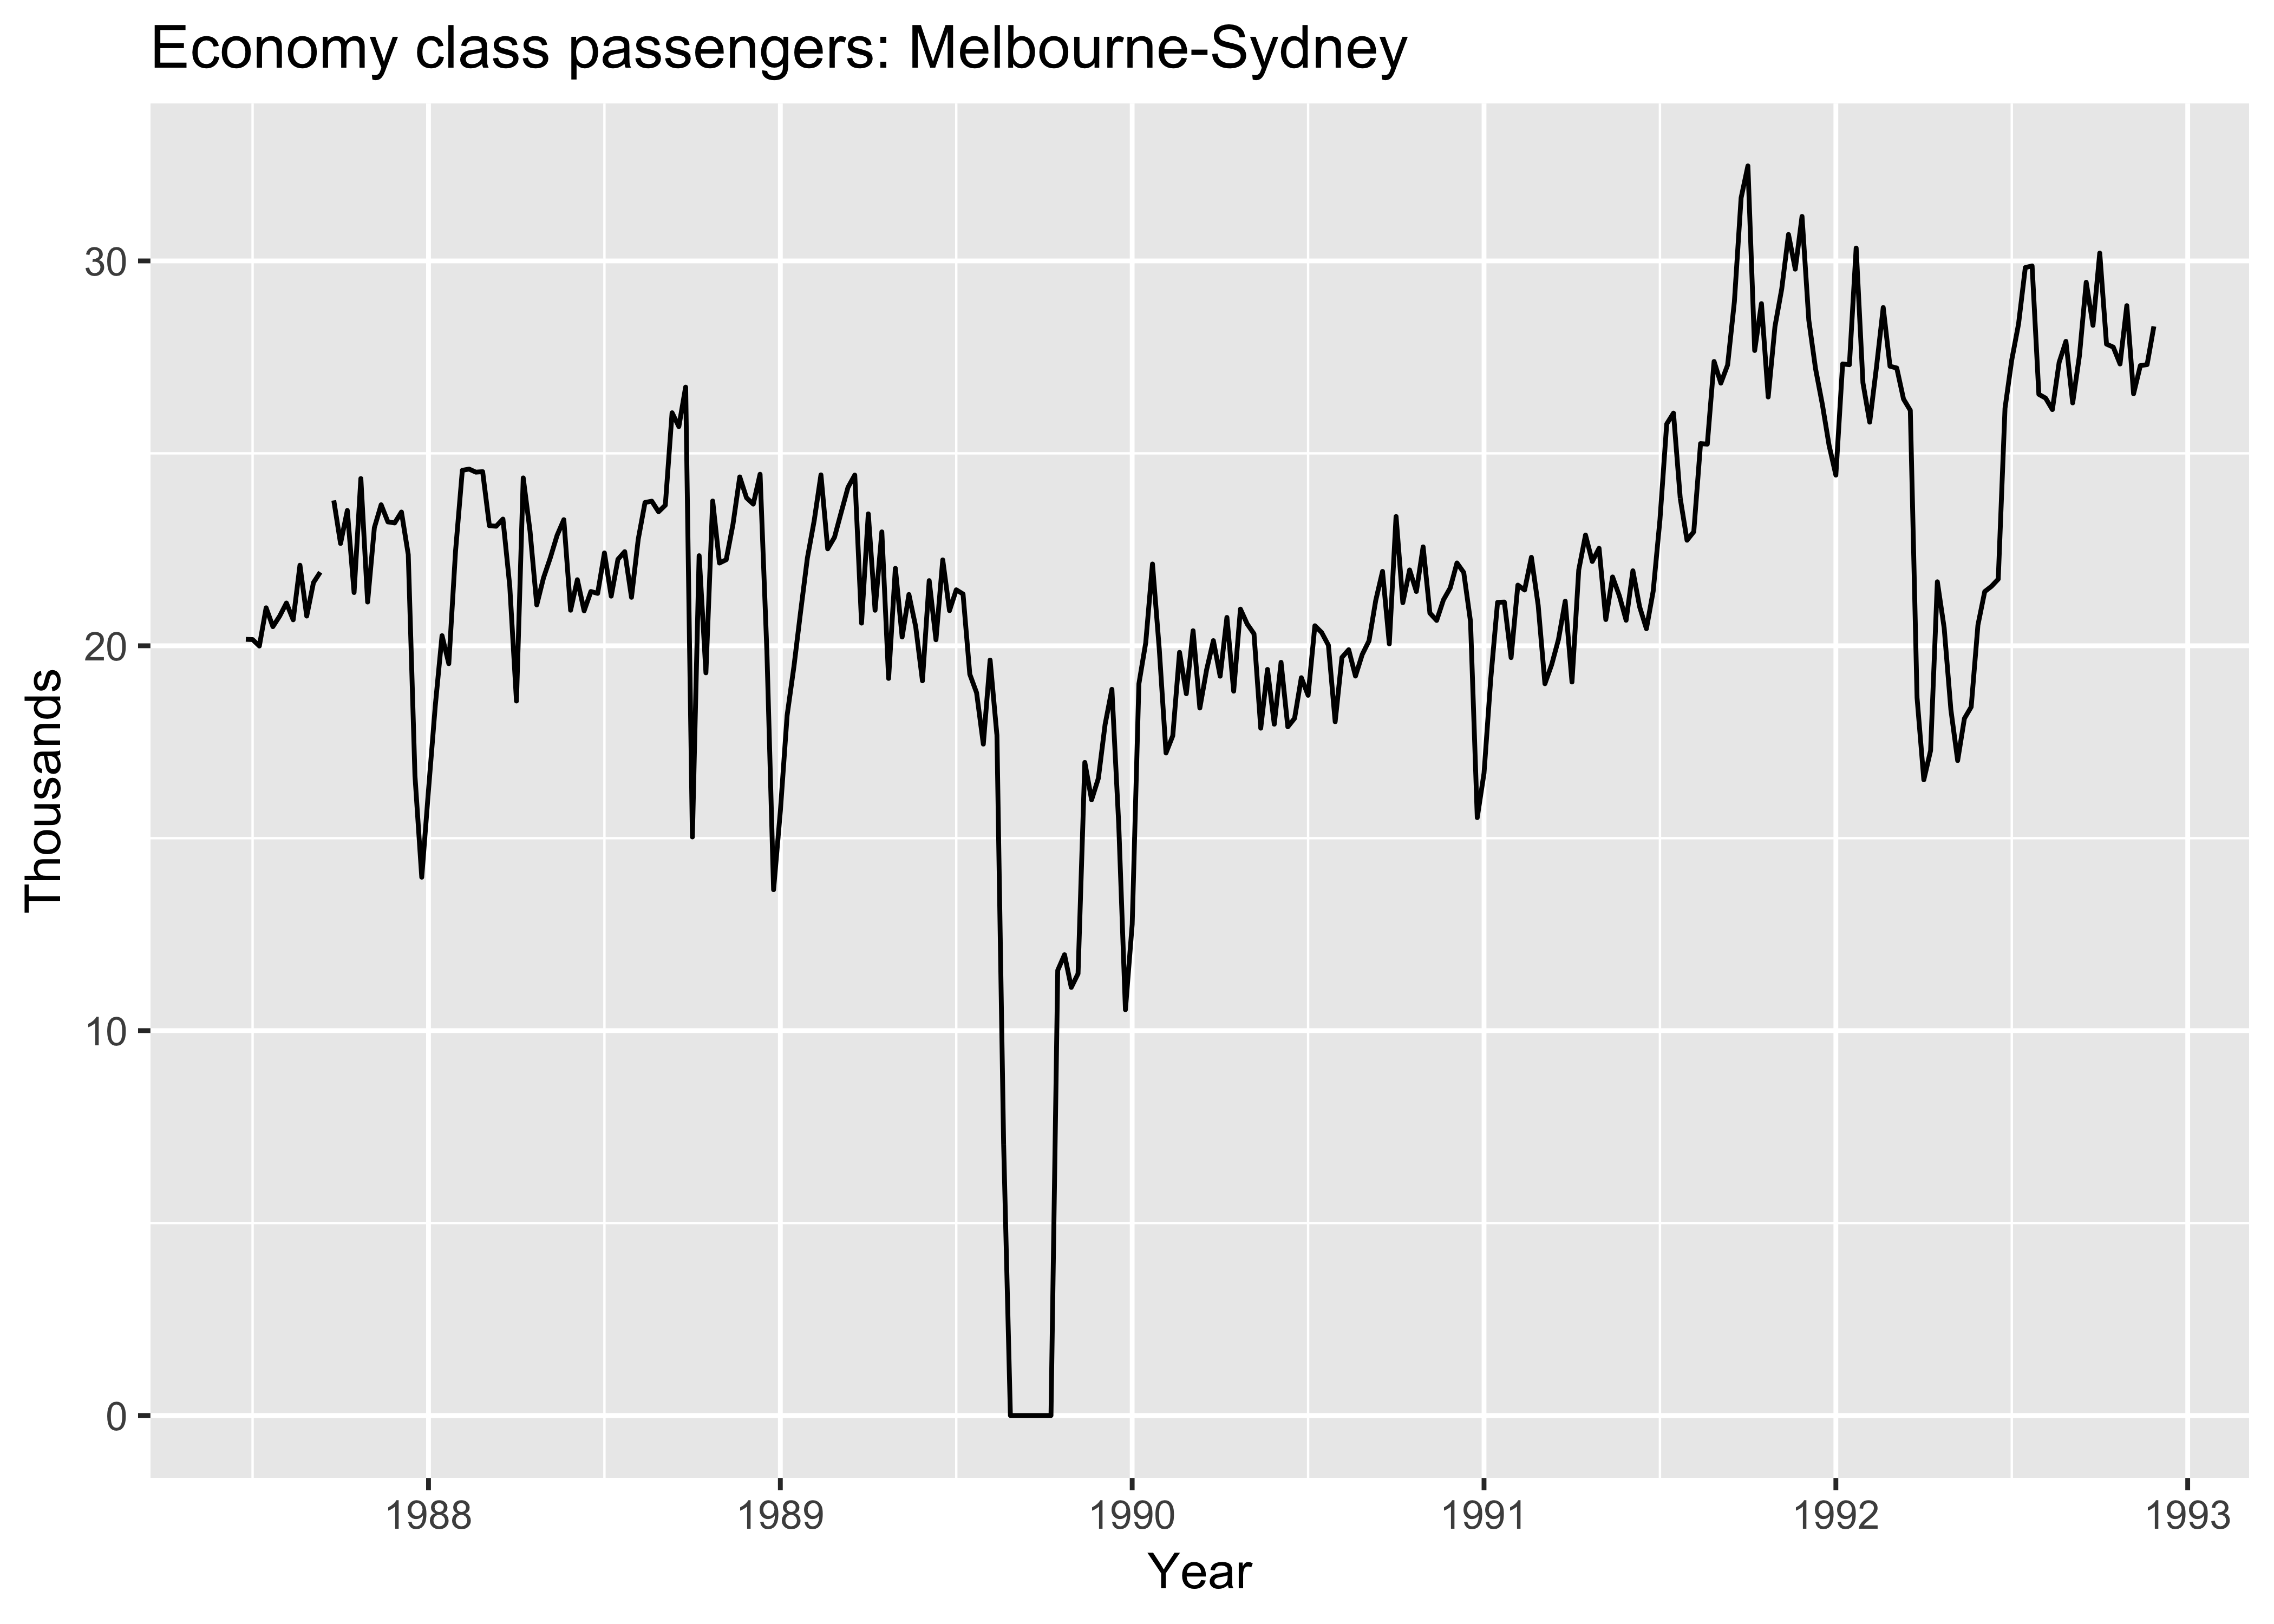
autoplot function sort of just thrown at us. I’m guessing it is loaded in the fpp2 package? Nope- looks like mainly data in there: https://github.com/robjhyndman/fpp2-package/tree/master/man
OK google says the ggfortify package: https://cran.r-project.org/web/packages/ggfortify/vignettes/plot_ts.html
Nope! You can do ?autoplot and one of the options is from the ggplot2 package. Help docs say (using printr from Yihui):
library(printr)
# ??autoplot
help.search('autoplot', package = 'ggplot2')| Package | Topic | Title |
|---|---|---|
| ggplot2 | autoplot | Create a complete ggplot appropriate to a particular data type |
So it is available because fpp2 loads ggplot2. Moving on 😉
Back to the syntax- melsyd is a time series object, so dplyr::glimpse does not work :(
library(dplyr)
glimpse(melsyd)
Time-Series [1:283, 1:3] from 1987 to 1993: 1.91 1.85 1.86 2.14 2.12 ...
- attr(*, "dimnames")=List of 2
..$ : NULL
..$ : chr [1:3] "First.Class" "Business.Class" "Economy.Class"# this does work
head(melsyd)Time Series:
Start = c(1987, 26)
End = c(1987, 31)
Frequency = 52
First.Class Business.Class Economy.Class
1987.481 1.912 NA 20.167
1987.500 1.848 NA 20.161
1987.519 1.856 NA 19.993
1987.538 2.142 NA 20.986
1987.558 2.118 NA 20.497
1987.577 2.048 NA 20.770OMG converting ts objects to other types is such a PITA. https://business-science.github.io/timetk/articles/TK00_Time_Series_Coercion.html
“The ts object class has roots in the stats package and many popular packages use this time series data structure including the popular forecast package. With that said, the ts data structure is the most difficult to coerce back and forth because by default it does not contain a time-based index. Rather it uses a regularized index computed using the start and frequency arguments. Coercion to ts is done using the ts() function from the stats library, which results in various problems.”
library(tidyverse)
library(timetk)
# ts to tibble: Comparison between as.data.frame() and tk_tbl()
melsyd_ts_timetk <- tk_ts(melsyd, start = c(1987, 26), freq = 52)
head(melsyd_ts_timetk)| First.Class | Business.Class | Economy.Class |
|---|---|---|
| 1.912 | NA | 20.167 |
| 1.848 | NA | 20.161 |
| 1.856 | NA | 19.993 |
| 2.142 | NA | 20.986 |
| 2.118 | NA | 20.497 |
| 2.048 | NA | 20.770 |
# now we see the time index, still an unnamed column
# Can now retrieve the original date index
melsyd_timetk_index <- tk_index(melsyd_ts_timetk, timetk_idx = TRUE)
head(melsyd_timetk_index)
[1] 1987.481 1987.500 1987.519 1987.538 1987.558 1987.577lag plots- what the hell am I looking at? Is one bad plot worse than another bad plot? origami cranes plot
Note that you can use non-integer frequencies to make ts objects using lubridate: https://stackoverflow.com/questions/22188660/r-time-series-modeling-on-weekly-data-using-ts-object